Text Tools
 Image Tools
 PDF Tools
 Social Media Tools
 Security Tools
 Coding Tools
 CSS Tools
 Color Tools
 Miscellaneous Tools
 Add to Chrome
 Add to Firefox


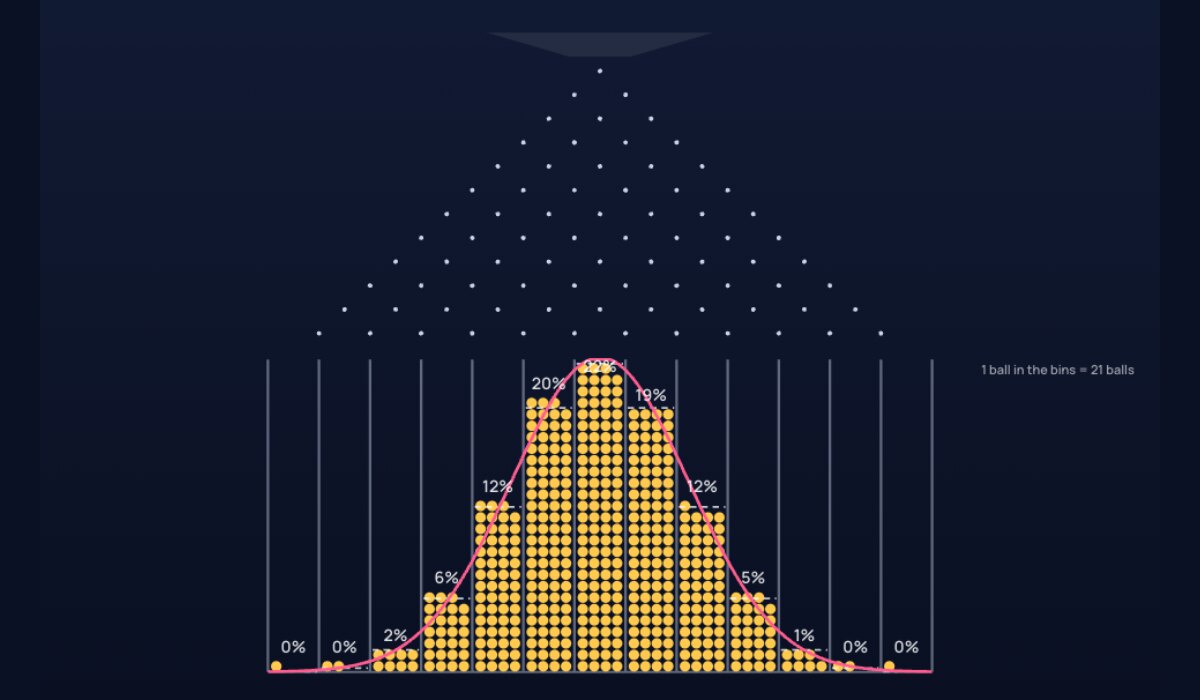
Drop balls through rows of pegs and watch them pile up in a bell curve, next to the binomial and normal curves.
At 50% the board is fair and the pile is symmetric; any other value tilts it.
Expected values for 12 rows and a 50% chance: mean n × p, standard deviation √(n × p × (1 − p)).
Bin by bin
| Bin | 0 | 1 | 2 | 3 | 4 | 5 | 6 | 7 | 8 | 9 | 10 | 11 | 12 |
|---|---|---|---|---|---|---|---|---|---|---|---|---|---|
| Balls | 0 | 0 | 0 | 0 | 0 | 0 | 0 | 0 | 0 | 0 | 0 | 0 | 0 |
| Share | – | – | – | – | – | – | – | – | – | – | – | – | – |
| Expected | <0.1% | 0.3% | 1.6% | 5.4% | 12.1% | 19.3% | 22.6% | 19.3% | 12.1% | 5.4% | 1.6% | 0.3% | <0.1% |
A ball's bin is the number of times it bounced right, from 0 on the left to 12 on the right. The highlighted bin is the likeliest.
What is Galton Board Simulator?
A Galton board (also called a bean machine or quincunx) is a board with rows of pegs. Balls dropped in at the top bounce left or right at each peg by chance and collect in bins at the bottom. No single ball can be predicted, yet together they always pile up in the same shape: a bell curve. Sir Francis Galton built it in 1873 to show this.
Features
- Animated balls bouncing through 2 to 30 rows of pegs.
- A biased board: set the chance of bouncing right from 5% to 95% and see the pile lean.
- Curves: the expected count of each bin (binomial distribution) and the normal curve, over the real pile.
- Statistics: the mean and standard deviation of the balls, next to the values theory predicts.
- Thousands of balls: add 1,000 or 10,000 at once to see the pile settle on the curve.
- Colours, percentages on the bins, full screen, pictures and video recording.
How to use Galton Board Simulator?
- Press Drop and watch the balls fall; change the speed and how many fall each second.
- Change the number of rows, or the chance of bouncing right, to start a new run.
- Add 1,000 or 10,000 balls at once to see the long-run shape.
- Compare the pile with the dashed expected counts and the pink normal curve, and the statistics below.
Frequently asked questions
Why do the balls form a bell curve?
A ball's bin is the number of times it bounced right. There is only one path to the far left or right bin, but many paths to the middle ones: with 12 rows there is 1 way to land in bin 0 and 924 ways to land in bin 6. The count of ways follows Pascal's triangle, so the bins fill in proportion to it.
What distribution does a Galton board show?
The binomial distribution: with n rows and a chance p of bouncing right, the chance of bin k is C(n, k) × p^k × (1 − p)^(n − k). Its mean is n × p and its standard deviation is √(n × p × (1 − p)). With many rows it gets close to the normal distribution, an example of the central limit theorem.
What is the central limit theorem?
It says that adding up many small random effects, whatever their own distribution, gives a total that follows a bell curve. Each bounce is one small effect, and a ball's final position is their sum, which is why the pile looks normal. The same reason makes heights, measurement errors and test scores bell-shaped.
Is it random?
Yes: each bounce uses your browser's random numbers, so every run is different, but with enough balls the shape always comes out the same. For other simulations, try the Double Pendulum Simulator and the Mandelbrot Zoom; to pick a random winner, use the List Randomizer.